Did the Sticky Stuff Ban Work? Analyzing the Impact of MLB’s Foreign Substance Crackdown
baseball
pitching
mlb
Author
Jack Lyons
Published
November 17, 2025
On June 21st, 2021, the MLB office sent a memo to all teams stating that umpire crews were to begin enforcing checks on all pitchers between innings to determine if any pitchers were using foreign substances or “sticky stuff” on their hands to aid in pitching. This decision had been anticipated for some time, and when it was implemented, not many MLB players were shocked. In fact, many pitchers later admitted to using sticky substances in the past to gain better control over pitches and increase spin rate, which helps create movement on a pitch, making it harder to hit.
Once the ban was enforced, all baseball fans and front office officials wondered one thing: would this lead to an increase in offensive production? For years, pitchers have dominated baseball, and offensive numbers have dropped to new all-time lows. So, what does the MLB do? They ban substances that give pitchers an advantage to try to level the playing field.
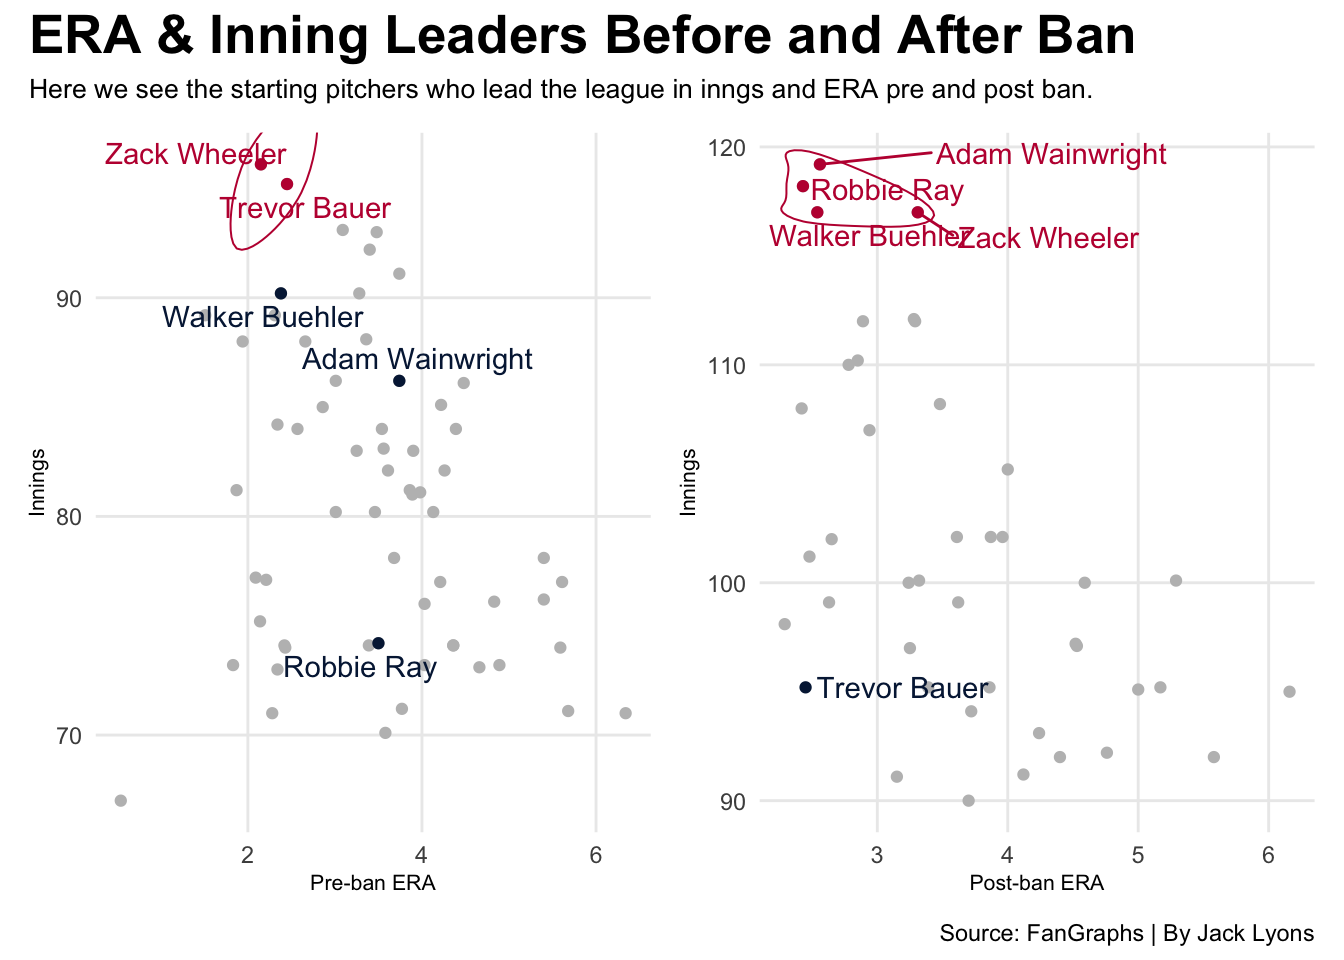
Let’s examine some data from the 2021 season to see if the foreign substance ban achieved its intended effect on pitchers and hitters. First, we’ll analyze pitcher ERA and innings pitched statistics during the pre- and post-ban periods of the 2021 season.
Code
library(tidyverse)library(ggrepel)library(gt)library(wehoop)library(gridExtra)library(patchwork)library(ggalt)teampre <-read_csv("Team ERA pre.csv") |>mutate(period="Pre-ban ERA")teampost <-read_csv("Team ERA post.csv") |>mutate(period="Post-ban ERA")teamoffpre <-read_csv("Team Off pre.csv") teamoffpost <-read_csv("Team Off post.csv")adpitchingpost <-read_csv("Advanced Pitching post.csv")pitcherpre <-read_csv("Pitcher ERA Pre.csv")pitcherpost <-read_csv("Pitcher ERA post.csv")playeroffpre <-read_csv("Player Off pre.csv")playeroffpost <-read_csv("Player Off post.csv")adpitchingpre <-read_csv(" Advanced Pitching pre.csv")team <-bind_rows(teampre, teampost)team <- team |>mutate(`2021`=factor(period, levels=c("Pre-ban ERA", "Post-ban ERA")))pitcherprename <- pitcherpre |>filter(Name =="Trevor Bauer")pitcherpostname <- pitcherpost |>filter(Name =="Trevor Bauer")p2pitcherprename <- pitcherpre |>filter(Name =="Robbie Ray"| Name =="Walker Buehler"| Name =="Adam Wainwright")zw <- pitcherpre |>filter(Name =="Zack Wheeler")zw2 <- pitcherpost |>filter(Name =="Zack Wheeler")good <- pitcherpre |>filter(ERA <2.5& IP >95)p1 <-ggplot() +geom_point(data=pitcherpre, aes(x=ERA, y= IP), color ="grey")+geom_point(data=good, aes(x=ERA, y= IP), color ="#BF0D3E")+geom_point(data=p2pitcherprename, aes(x=ERA, y= IP), color ="#041E42")+geom_text_repel(data = p2pitcherprename, aes(x=ERA, y= IP, label = Name), color ="#041E42") +geom_text_repel(data = good, aes(x=ERA, y=IP, label = Name), color ="#BF0D3E") +geom_encircle(data= good, aes(x=ERA, y=IP), s_shape=.03, expand=.03, colour="#BF0D3E") +labs(x="Pre-ban ERA", y="Innings") +theme_minimal() +theme(plot.title =element_text(size =20, face ="bold"),axis.title =element_text(size =8), plot.subtitle =element_text(size=10), panel.grid.minor =element_blank() ) goodpost <- pitcherpost |>filter(ERA <3.5& IP >114)p2 <-ggplot() +geom_point(data=pitcherpost, aes(x=ERA, y= IP), color ="grey")+geom_point(data=goodpost, aes(x=ERA, y= IP), color ="#BF0D3E")+geom_point(data=pitcherprename, aes(x=ERA, y= IP), color ="#041E42")+geom_text_repel(data = pitcherprename, aes(x=ERA, y= IP, label = Name), color ="#041E42") +geom_text_repel(data = goodpost, aes(x=ERA, y=IP, label = Name), color ="#BF0D3E") +geom_encircle(data= goodpost, aes(x=ERA, y=IP), s_shape=.03, expand=.03, colour="#BF0D3E") +labs(x="Post-ban ERA", y="Innings") +theme_minimal() +theme(plot.title =element_text(size =20, face ="bold"),axis.title =element_text(size =8), plot.subtitle =element_text(size=10), panel.grid.minor =element_blank() )p1 + p2 +plot_annotation(title ="ERA & Inning Leaders Before and After Ban",subtitle ="Here we see the starting pitchers who lead the league in inngs and ERA pre and post ban.",caption ="Source: FanGraphs | By Jack Lyons" ) &theme(plot.title =element_text(size =20, face ="bold"),axis.title =element_text(size =8), plot.subtitle =element_text(size=10), panel.grid.minor =element_blank() )
Interestingly, the only pitcher who leaves that highlighted area is Trevor Bauer, while Zack Wheeler finds success in both time periods. However, we can see that many unlisted pitchers are dropping off the chart in the post-ban era, whether that’s because they didn’t meet the inning count or because they were using a foreign substance and struggled to adjust; we might never know. Joining Zack Wheeler are Adam Wainwright, Walker Buehler, and 2021 AL Cy Young winner Robbie Ray, all of whom showed notable progress in the post-ban period.
Now we shift our focus from pitchers to hitters. The main reason the MLB decided to ban foreign substances is that, for years, pitchers have dominated baseball, leading to gradual drops in league-wide offensive stats. Let’s see if this foreign substance ban has helped hitters and boosted overall offensive numbers.
Code
prename <- playeroffpre |>filter(Name =="Vladimir Guerrero Jr."| Name =="Matt Olson")postname <- playeroffpost |>filter(Name =="Vladimir Guerrero Jr."| Name =="Matt Olson")p22prename <- playeroffpre |>filter(Name =="Bryce Harper"| Name =="Austin Riely"| Name =="Juan Soto"| Name =="Paul Goldschmidt")p22postname <- playeroffpost |>filter(Name =="Bryce Harper"| Name =="Austin Riely"| Name =="Juan Soto"| Name =="Paul Goldschmidt")playerpre <- playeroffpre |>filter(HR >17& AVG > .30)p11 <-ggplot() +geom_point(data=playeroffpre, aes(x=AVG, y= HR), color="grey")+geom_point(data=playerpre, aes(x=AVG, y= HR), color="#BF0D3E")+geom_point(data=p22prename, aes(x=AVG, y= HR), color="#041E42")+geom_text_repel(data = p22prename, aes(x=AVG, y=HR, label = Name), color ="#041E42") +geom_text_repel(data = playerpre, aes(x=AVG, y=HR, label = Name), color ="#BF0D3E") +geom_encircle(data= playerpre, aes(x=AVG, y=HR), s_shape=.03, expand=.03, colour="#BF0D3E") +labs(x="Pre-ban AVG", y="Home Runs") +theme_minimal() +theme(plot.title =element_text(size =20, face ="bold"),axis.title =element_text(size =8), plot.subtitle =element_text(size=10), panel.grid.minor =element_blank() ) playerpost <- playeroffpost |>filter(HR >20& AVG > .30)p22 <-ggplot() +geom_point(data=playeroffpost, aes(x=AVG, y= HR), color ="grey")+geom_point(data=playerpost, aes(x=AVG, y= HR), color="#BF0D3E")+geom_point(data=postname, aes(x=AVG, y= HR), color="#041E42")+geom_text_repel(data = postname, aes(x=AVG, y=HR, label = Name), color ="#041E42") +geom_text_repel(data = playerpost, aes(x=AVG, y=HR, label = Name), color ="#BF0D3E") +geom_encircle(data= playerpost, aes(x=AVG, y=HR), s_shape=.03, expand=.03, colour="#BF0D3E") +labs(x="Post-ban AVG", y="Home Runs") +theme_minimal() +theme(plot.title =element_text(size =20, face ="bold"),axis.title =element_text(size =8), plot.subtitle =element_text(size=10), panel.grid.minor =element_blank() ) p11 + p22 +plot_annotation(title ="Batting AVG & HR Leaders Before and After Ban",subtitle ="These players lead the MLB in both home runs and batting average before and after the ban.",caption ="Source: FanGraphs | By Jack Lyons" ) &theme(plot.title =element_text(size =20, face ="bold"),axis.title =element_text(size =8), plot.subtitle =element_text(size=10), panel.grid.minor =element_blank() )
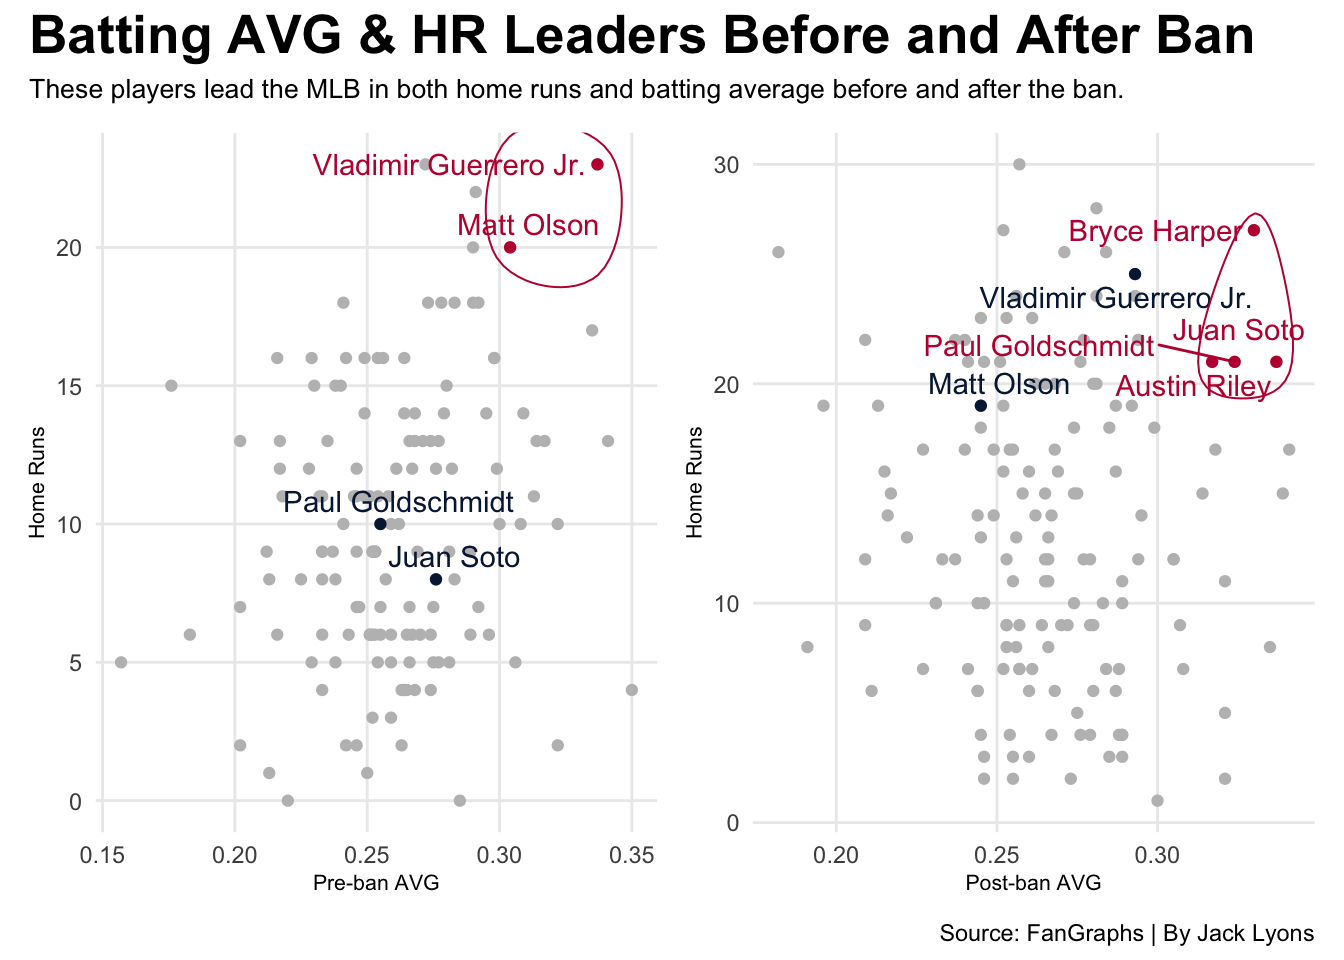
In the pre-ban era, only two major league players truly stood out with exceptional numbers: Vladimir Guerrero Jr. and Matt Olson. Both players excelled during that period, with Guerrero Jr. hitting 23 home runs and Olson hitting 20. However, in the post-ban era, there was a surge of players reaching that high level of offensive output. In the post-ban era, we see the soon-to-be 2021 NL MVP, Bryce Harper, who hit 27 home runs, along with Paul Goldschmidt, Austin Riley, and Juan Soto, all of whom hit 21 home runs while also having batting averages over .300. This indicates a clear shift in offensive production after the ban.
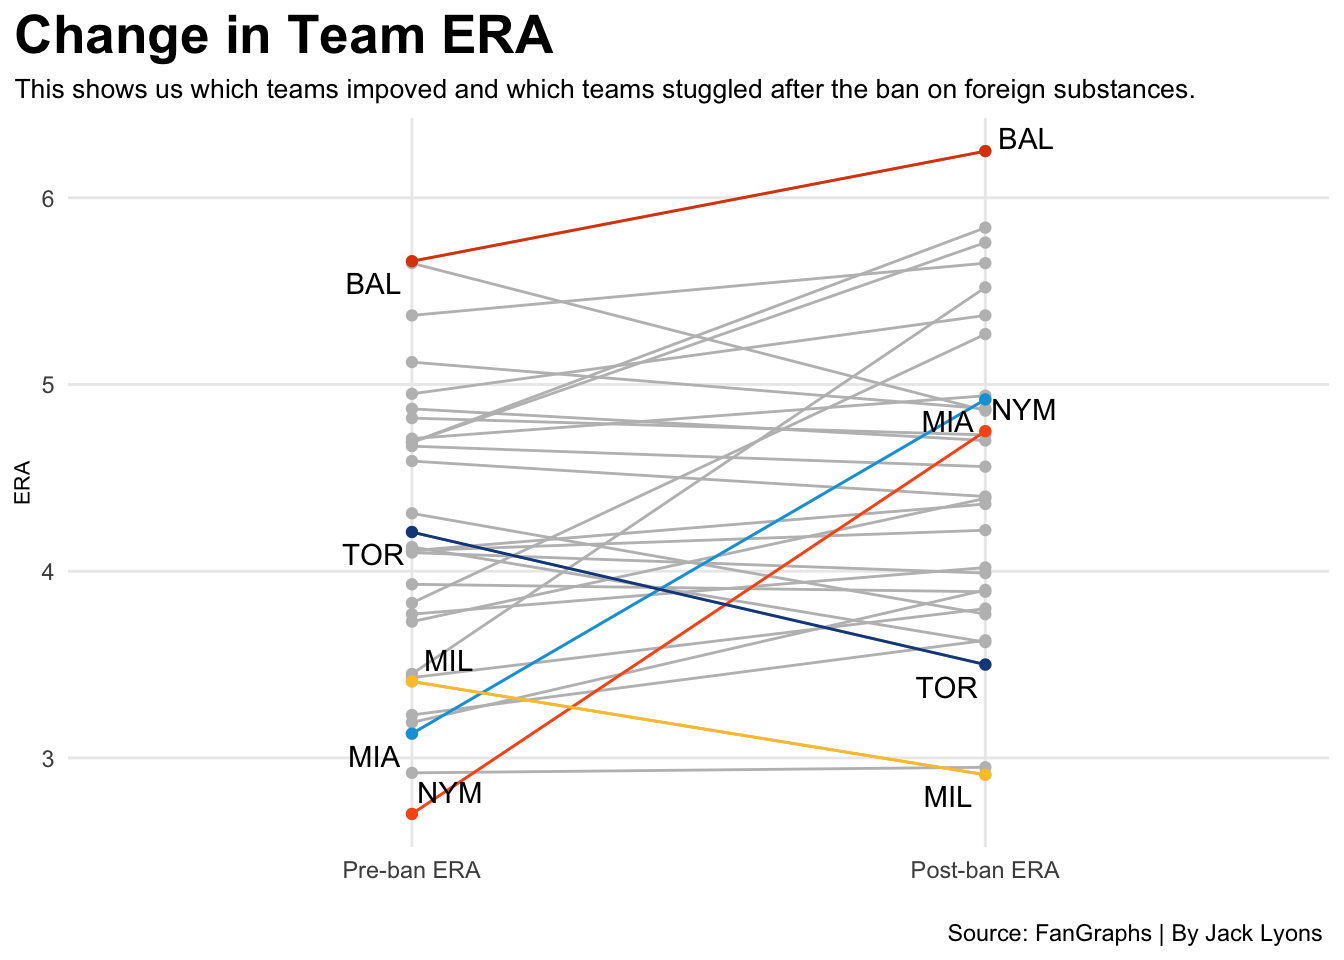
However, we should revisit some pitching metrics. Now, let’s examine team ERA before and after the ban. This should reveal which teams benefited from their pitchers using sticky substances by showing the change in ERA during the 2021 season.
Code
Mets <- team |>filter(Team =="NYM")Marlins <- team |>filter(Team =="MIA")Jays <- team |>filter(Team =="TOR")Brewers <- team |>filter(Team =="MIL")Orioles <- team |>filter(Team =="BAL")ggplot() +geom_line(data=team, aes(x=`2021`, y= ERA, group=Team), color="grey") +geom_point(data=team, aes(x=`2021`, y=ERA, group=Team), color="grey")+geom_line(data=Mets, aes(x=`2021`, y= ERA, group=Team), color="#FF5910") +geom_point(data=Mets, aes(x=`2021`, y=ERA, group=Team), color="#FF5910")+geom_line(data=Marlins, aes(x=`2021`, y= ERA, group=Team), color="#00A3E0") +geom_point(data=Marlins, aes(x=`2021`, y=ERA, group=Team), color="#00A3E0")+geom_point(data=Jays, aes(x=`2021`, y=ERA, group=Team), color="#134A8E")+geom_line(data=Jays, aes(x=`2021`, y=ERA, group=Team), color="#134A8E")+geom_point(data=Brewers, aes(x=`2021`, y=ERA, group=Team), color="#ffc52f")+geom_line(data=Brewers, aes(x=`2021`, y=ERA, group=Team), color="#ffc52f")+geom_point(data=Orioles, aes(x=`2021`, y=ERA, group=Team), color="#DF4601")+geom_line(data=Orioles, aes(x=`2021`, y=ERA, group=Team), color="#DF4601")+geom_text_repel(data=Orioles, aes(x=`2021`, y=ERA, group=Team, label=Team)) +geom_text_repel(data=Brewers, aes(x=`2021`, y=ERA, group=Team, label=Team)) +geom_text_repel(data=Jays, aes(x=`2021`, y=ERA, group=Team, label=Team)) +geom_text_repel(data=Marlins, aes(x=`2021`, y=ERA, group=Team, label=Team)) +geom_text_repel(data=Mets, aes(x=`2021`, y=ERA, group=Team, label=Team)) +labs(title="Change in Team ERA",subtitle ="This shows us which teams impoved and which teams stuggled after the ban on foreign substances.",x="",y="ERA",caption="Source: FanGraphs | By Jack Lyons " ) +theme_minimal() +theme(plot.title =element_text(size =20, face ="bold"),axis.title =element_text(size =8), plot.subtitle =element_text(size=10), panel.grid.minor =element_blank(),plot.title.position ="plot" )
There’s a lot to look at here, but for the most part, many teams took a step back with their ERA in the post-ban era, while others made a significant jump, and still others experienced a decline.
Let’s first take a look at the New York Mets, who had one of the most significant declines. The Mets, entering June 21st, had a league-best 2.70 team ERA, but in the period after the ban, posted an ERA of 4.75. We also had the Miami Marlins, who held an ERA of 3.13 at the beginning of the ban, but dropped to 4.92. On the other hand, the Toronto Blue Jays and Milwaukee Brewers actually improved during the ban, with the Blue Jays dropping their ERA from 4.21 to 3.50, while the Brewers went from a 3.41 ERA to a league-best 2.91 during the ban.
Now let’s take a look at the year-end totals for pitching stats, and if there was an actual difference in statistics.
Code
pre <- adpitchingpre |>select(ERA, `K%` ,`BB%`, `HR/9` ) |>mutate(`2021`="Pre-ban" )post <- adpitchingpost |>select(ERA, `K%` ,`BB%`, `HR/9` ) |>mutate(`2021`="Post-ban" )total <-as_tibble_row(c(`2021`="Total", ERA =+.32, `K%`="-1.5%", `BB%`="-0.1%", `HR/9`=+0.12))total <- total |>mutate(ERA =as.numeric(ERA),`HR/9`=as.numeric(`HR/9`) )summaries <-bind_rows(pre, post, total)summaries |>select(`2021`, everything()) |>gt() |>tab_header(title ="League Wide Pitching Data in 2021",subtitle ="This is where we compare pitching data leauge wide, pre and post ban." ) |>tab_style(style =cell_text(color ="black", weight ="bold", align ="left"),locations =cells_title("title") ) |>tab_style(style =cell_text(color ="black", align ="left"),locations =cells_title("subtitle") ) |>tab_style(style =list(cell_fill(color ="#BF0D3E"),cell_text(color ="white") ),locations =cells_body(rows =`2021`=="Total") ) |>tab_style(locations =cells_column_labels(columns =everything()),style =list(cell_borders(sides ="bottom", weight =px(3)),cell_text(weight ="bold", size=12) ) ) |>opt_row_striping() |>opt_table_lines("none") |>tab_source_note(source_note =md("**By:** Jack Lyons | **Source:** FanGraphs Major League Pitching 2021") )
League Wide Pitching Data in 2021
This is where we compare pitching data leauge wide, pre and post ban.
2021
ERA
K%
BB%
HR/9
Pre-ban
4.16
23.40%
7.90%
1.26
Post-ban
4.48
21.90%
7.80%
1.38
Total
0.32
-1.5%
-0.1%
0.12
By: Jack Lyons | Source: FanGraphs Major League Pitching 2021
Surprisingly, the MLB was right. The ban on sticky substances used by pitchers led to an increase in offensive output. Although small, a 0.32-point rise in league-wide ERA is a significant jump in overall offense, and additionally, we observed a 1.5% drop in strikeout rate. While these numbers may not stand out immediately, they indicate that in the post-foreign-substance era, pitchers struggled more than before, and importantly, league-wide offense increased.
Throughout this process, we observed noticeable changes in both offensive and pitching metrics before and after the foreign substance ban, indicating some level of success. MLB aimed not only to reduce cheating by pitchers but also to improve overall offensive performance, and the data shows that they achieved this. Many hitters significantly enhanced their statistics along with league-wide increases in home run rates. On the pitching side, unaffected pitchers stood out from those whose numbers declined, whether due to restrictions on foreign substances or the season’s length.
MLB’s effort to eliminate foreign substances from baseball has been quite effective. Umpires routinely check all pitchers between innings, even five years after the initial ban, establishing a common practice that seems to be successful. Concerning the rise in offensive numbers, only time will reveal the full impact, but the data in these graphs show that offensive stats are indeed on the rise, in large, because of this ban.